Story Telling Made More Sense Through Online Mapping
What makes Topo.ly the most sought-after data analytic tool is that through online mapping, the users are ab le to understand the story behind colored territories and attractive location markers.
Online, February 5, 2013 (Newswire.com) - Data analysis tools applied used today do not meet the needs of many organizations. This resonates with many businesses both small and large. Most are complicated to use and bring just the basic facts, not really something that most companies can use in every aspect in running their businesses. This is where Topo.ly's business intelligence tools took the high road. Its online mapping applications help many companies extract the real meaning of their data and use them to make fact-based decisions.
This is what Benjamin B., a Facilities Manager in University of Maine Facilities Managements said about Topo.ly: "This is a powerful tool for anyone trying to manage a large number of mapping points! Other mapping systems on the web just don't compare-Topo.ly is where it's at!"
Extracting Ideas Behind Location Markers
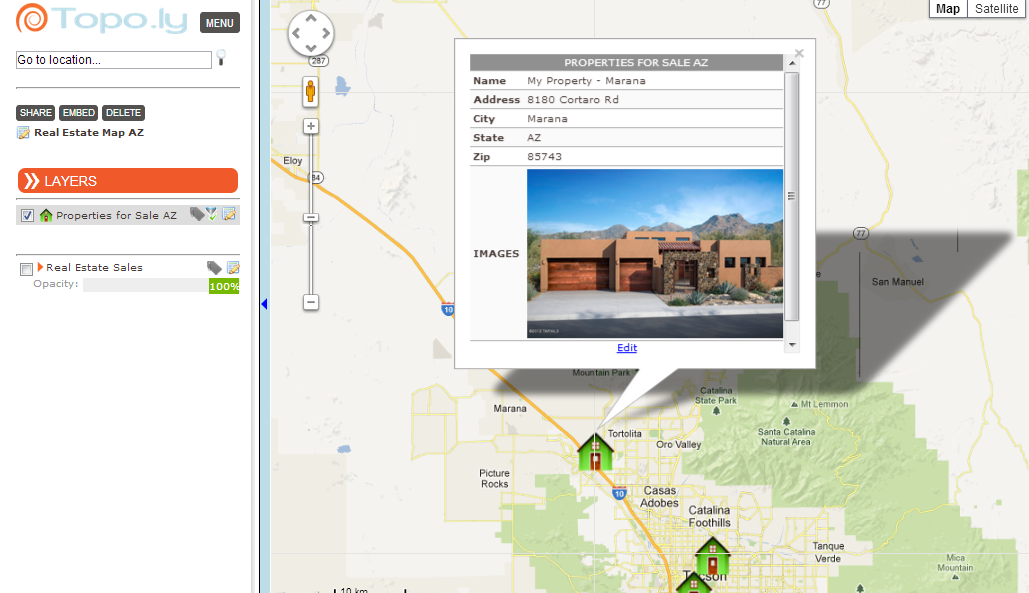
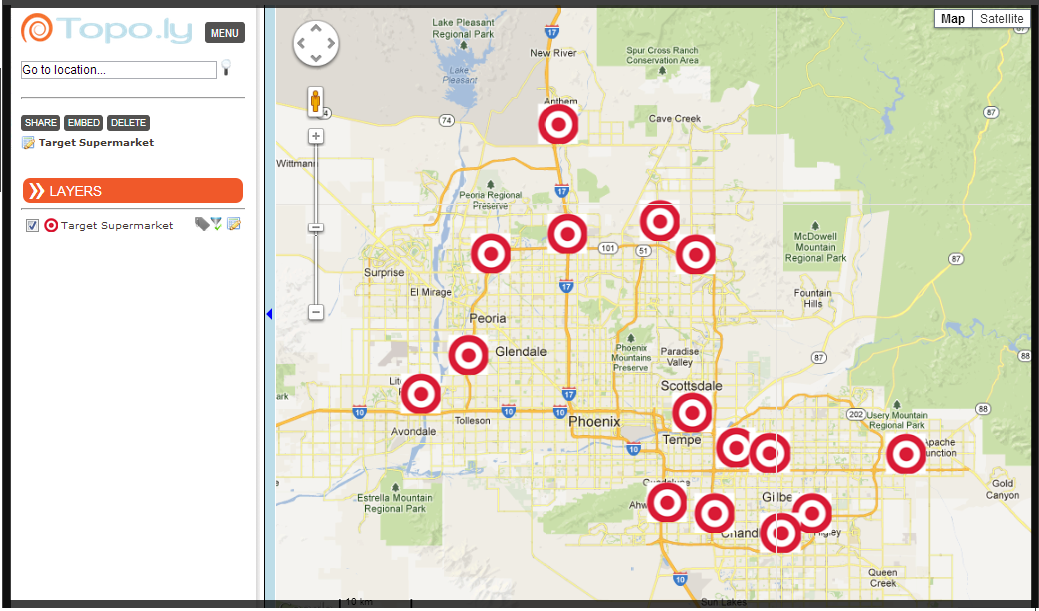
When data collated from Microsoft Excel spreadsheets are pasted to Topo.ly's online mapping site, brilliant ideas immediately flourish. The site is committed to provide exceptional visual experience through GIS maps. It is being used by hundreds of different companies not only in the USA but all throughout the world for:
- Enhanced market planning
- Identify growth opportunities
- Mitigate market risks
- Optimize logistics
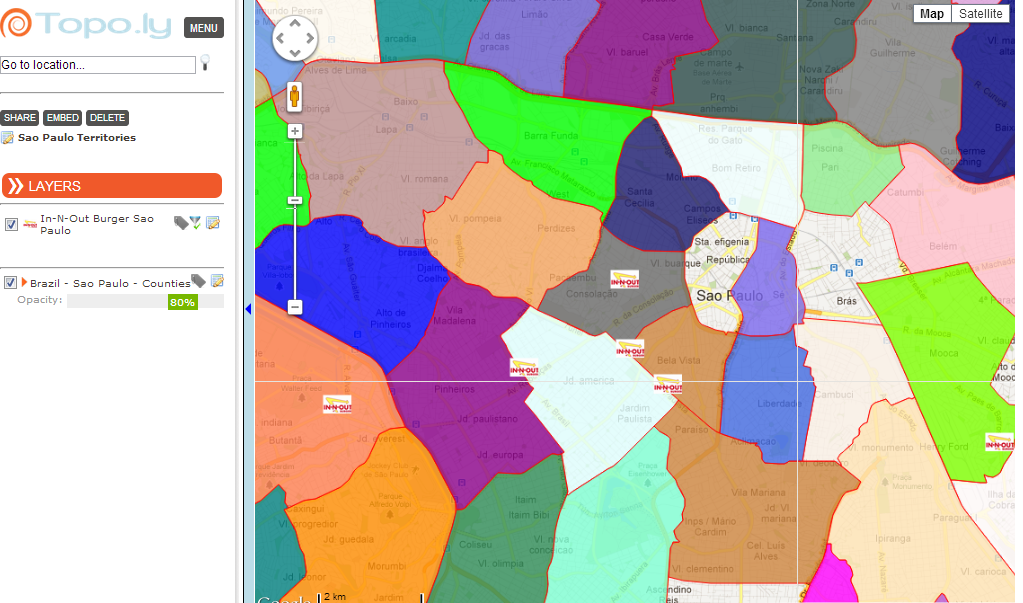
To accomplish this goal, its Plus Features allow users to add territory layers for further analysis. To get the most from modern mapping technology, new territory layers are continually added to benefit its growing number of users. Among its most popular territories include:
- World Countries
- Australia States
- Brazil States
- Canada Provinces
- Mexico States
- UK Countries
- US 3-Digit Zip Codes
- US 5-digit Zip Codes (by States)
- US Counties
- US States
- Many more!
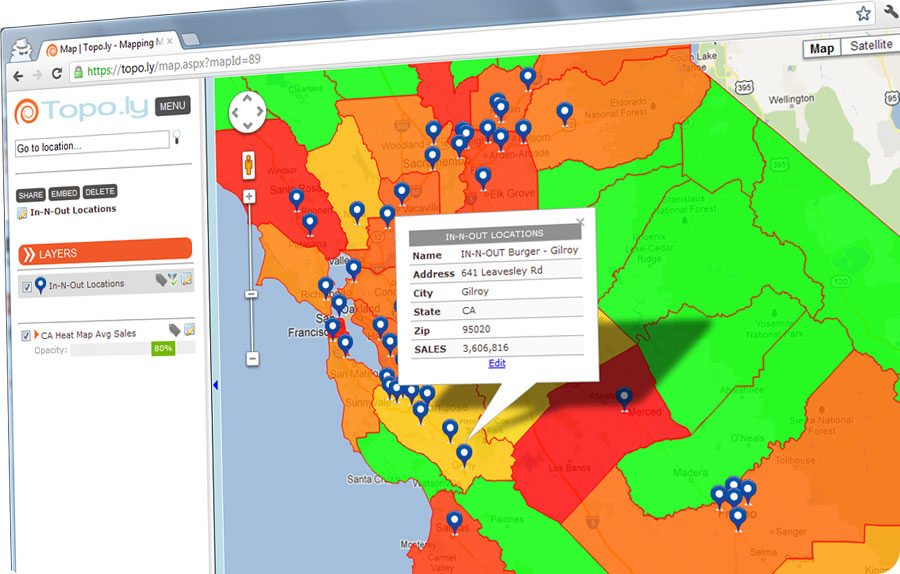
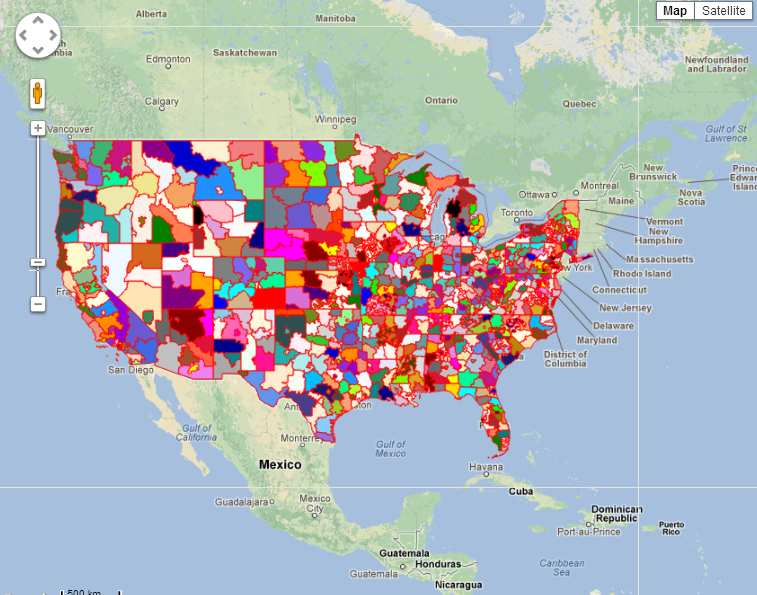
The business intelligence tools developed by Topo.ly over time allow the users to imbibe the exact meaning of their data. Through its attractive maps, ideas are easily extracted behind location markers. The maps use exceptionally bright colors to give way to its hundreds of users to visualize story behind their data. It feeds the users the right information from where they will be getting decisions to further business plans and create steps necessary to improve.
Don't be lulled in data analysis tools that do not allow the users to grasp the real sense of data. Use Topo.ly to help extract the real stories behind data as it is committed to data simplification to get the real sense of data.
Related Media